Estimating the amplification efficiency of qPCR
Source:vignettes/amplification_efficiency.Rmd
amplification_efficiency.RmdAdjusting qPCR data according based on amplification efficiency is an important step for estimating pathogen presence accurately and reliably. Amplification efficiency refers to how effectively a PCR reaction duplicates the target nucleic acid in each cycle (see Thermo Fisher’s Efficiency of Real-Time PCR). If efficiency of 100% is reached, then the quantity of the target will double with each cycle. However, variations in the PCR reactions due to reagents or template quality can degrade efficiency (Stolovitzky and Cecchi 1996). It is also likely that when performing environmental sampling, there will be additional inhibitors for the environment in the sample that may cause further inefficiency of the PCR reaction. Therefore, it is important to quantify and account for these inefficiencies because they can lead to significant inaccuracies in the quantification of gene expression levels and subsequent detection of pathogens.
Estimation of amplification efficiency using the standard curve method
We have included two functions
(est_amplification_efficiency() and
apply_amplification_efficiency()) to assist in efficiency
calculations. These functions use the standard curve method to estimate
the percentile amplification efficiency for each target in the provided
standard curve data (Yuan, Wang, and Stewart 2008; Yuan et al. 2006). Note that data must
be in the standardized format described in the
template_WES_standard_curve data object. To estimate the
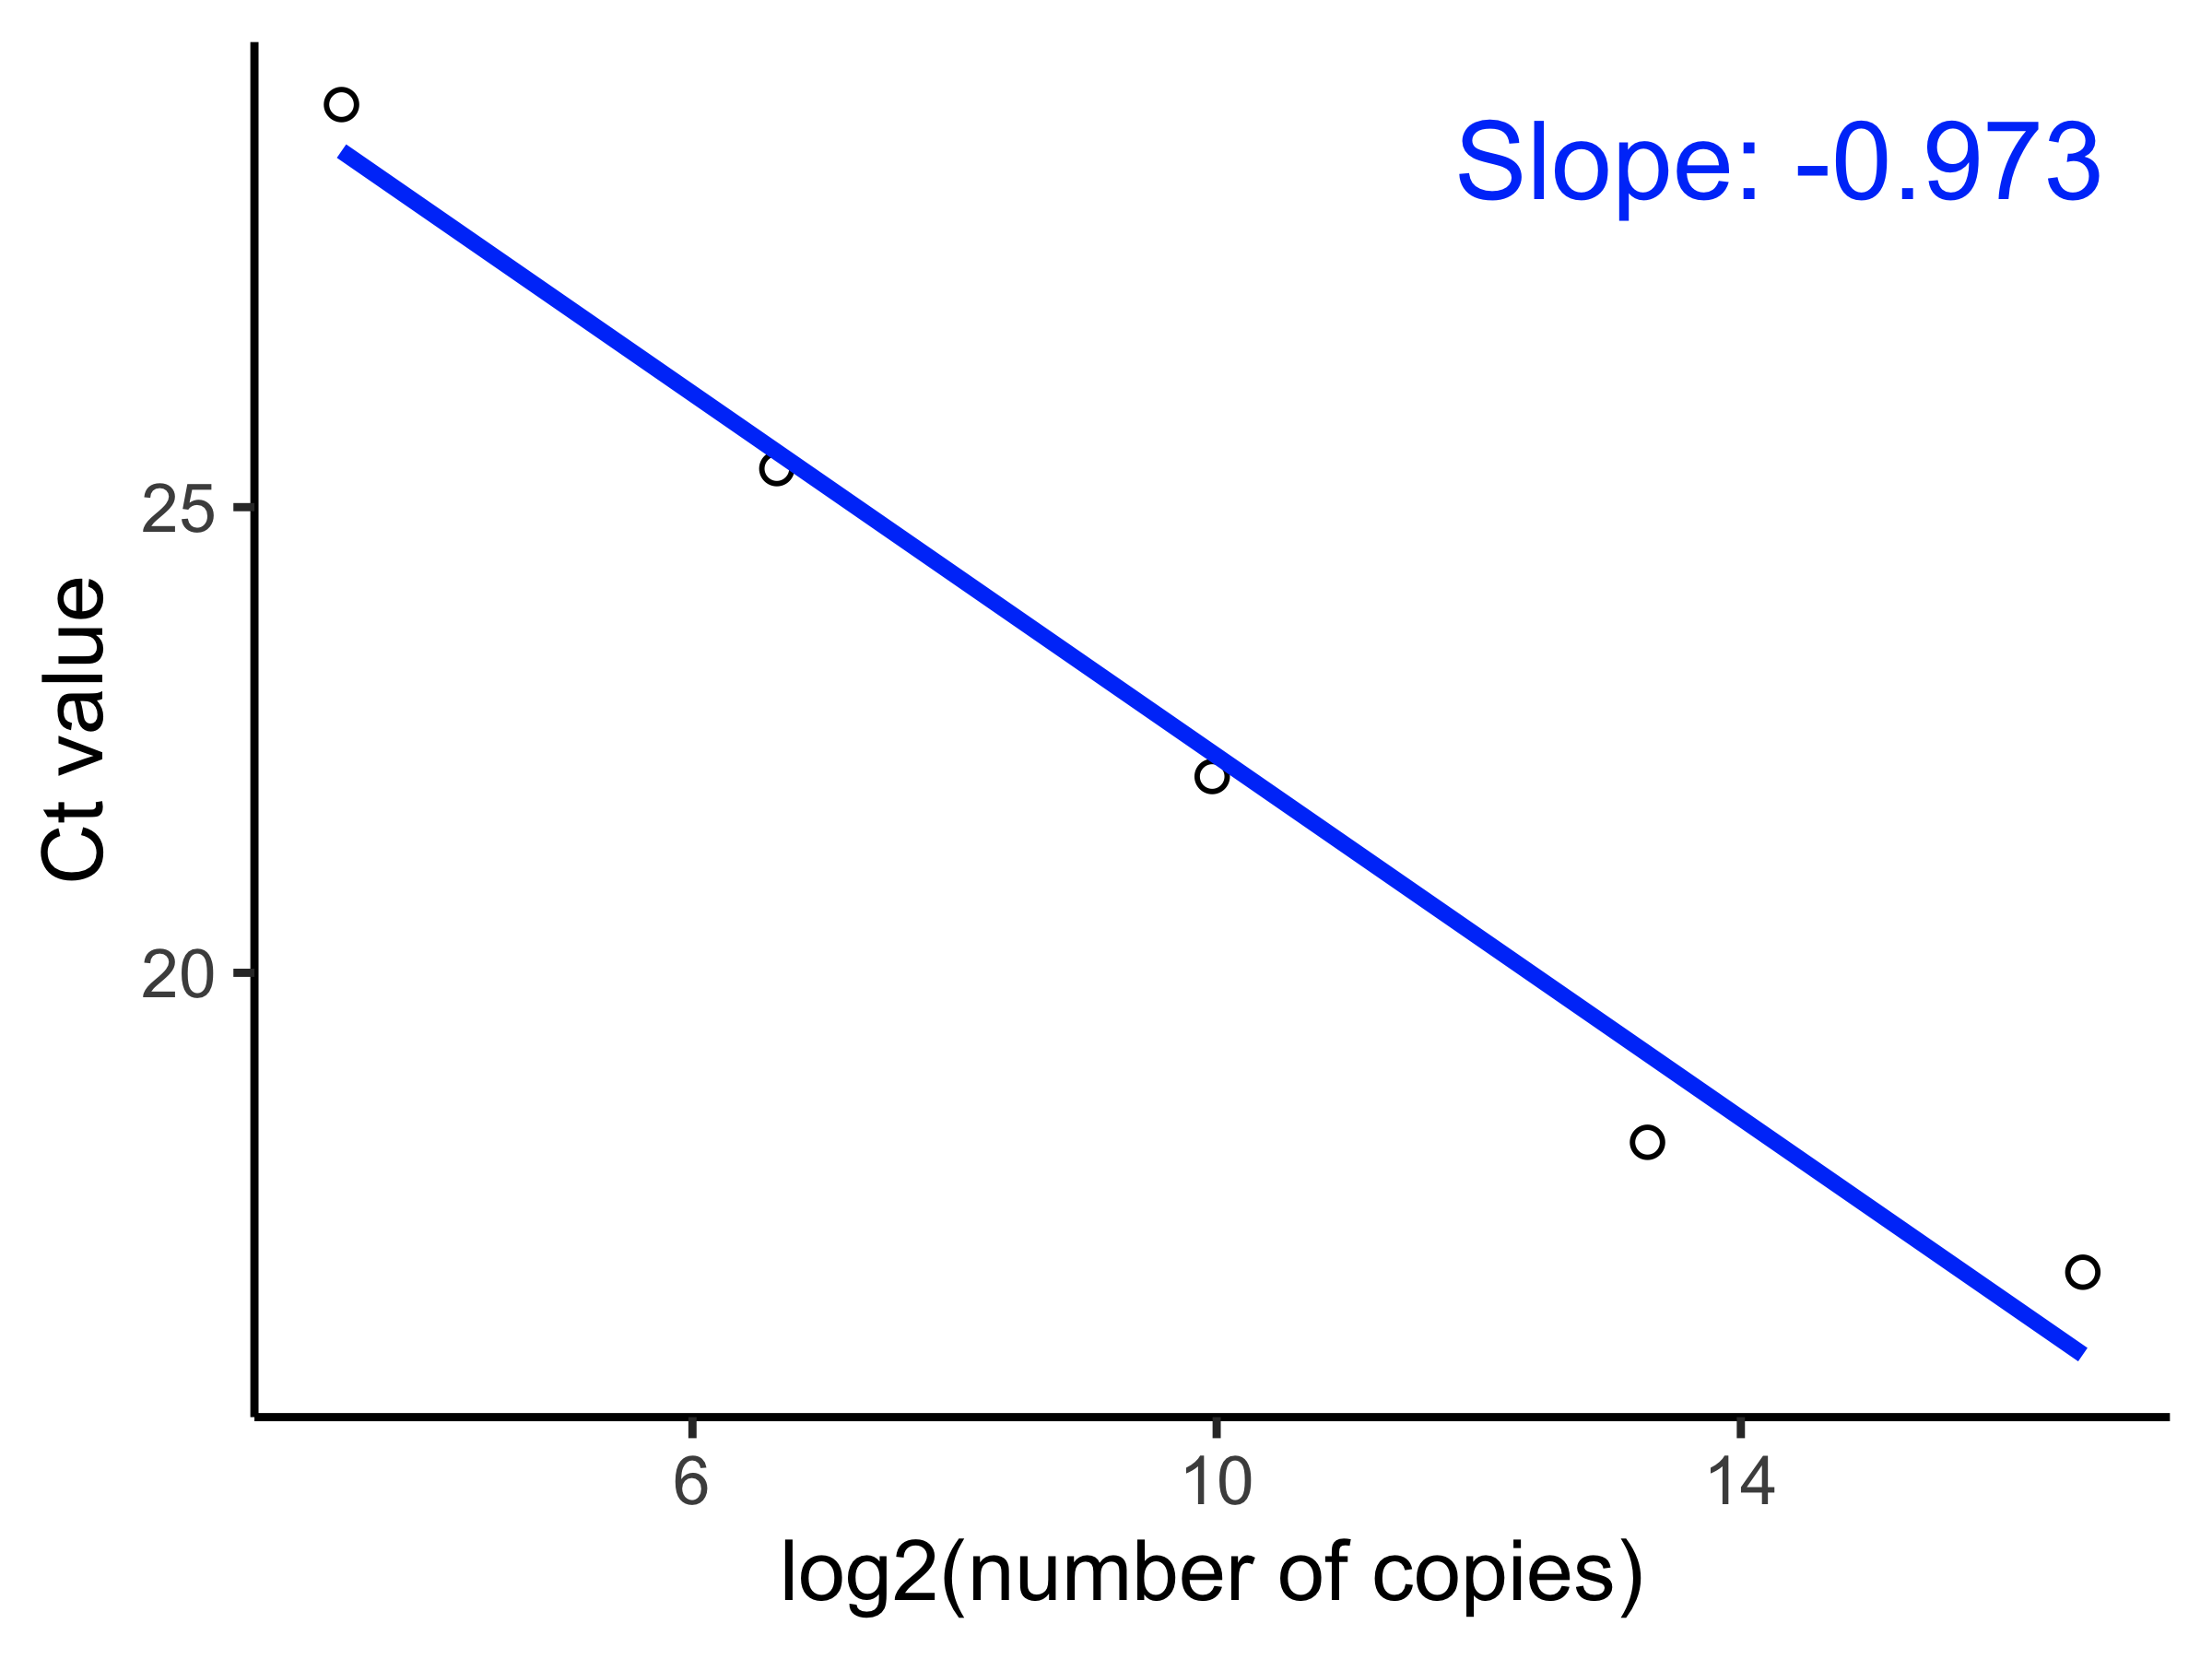
percentile amplification efficiency \(\phi\), we fit the following linear model
to get the slope \(\beta_{\text{efficiency}}\):
\[\text{Ct}_{ij} = \alpha + \beta_{\text{efficiency}} \text{log}_2\big(S_{ij}\big) + \epsilon.\]
Where \(S_{ij}\) is the serially diluted concentration of the target nucleic acid for observation \(i\) and gene target \(j\), and the percentile amplification efficiency is \(\phi = -\beta_{\text{efficiency}}\). Assuming that the standard curve assay contains greater than 5 observations and target concentrations double with each serial dilution, we expect that \(\phi = 1\) in the case of perfect efficiency and \(\phi < 1\) otherwise.
The following code will estimate \(\phi\) and its 95% confidence intervals for
a single target using est_amplification_efficiency():
sel <- template_WES_standard_curve$target_name == 'target_3'
tmp_n_copies <- template_WES_standard_curve$n_copies[sel]
tmp_ct_value <- template_WES_standard_curve$ct_value[sel]

est_amplification_efficiency(n_copies = tmp_n_copies,
                             ct_value = tmp_ct_value)

$mean
[1] 0.9718572

$ci_lo
[1] 1.221067

$ci_hi
[1] 0.7226478
And apply_amplification_efficiency() will apply the same
function to all gene targets within a data frame following the format of
the template_WES_standard_curve data object: