To use the data and methods provided in the ‘WES’ R package, input
data must match the formatting shown in the
template_WES_data and
tamplate_WES_standard_curves data objects. These objects
are installed along with the ‘WES’ package and provide a starting point
to calculate derivative quantities, adding spatial metadata, and
launching the visualization application. Both template data sources are
described in more detail below:
Template environmental sampling data
The primary data that is required for the methods in the ‘WES’
package is shown in the template_WES_data object. These
data have 6 columns and give the time and location of each observation
and a Cycle Threshold (Ct) value from a qPCR assay. The code below shows
how to view the data template:
library(WES)
head(template_WES_data)
date location_id  lat   lon target_name ct_value
1 2020-03-07           1 23.8 90.37    target_0       NA
2 2020-03-07           1 23.8 90.37    target_0       NA
3 2020-03-07           1 23.8 90.37    target_0       NA
4 2020-03-07           1 23.8 90.37    target_0 29.94516
5 2020-03-07           1 23.8 90.37    target_1 31.61178
6 2020-03-07           1 23.8 90.37    target_1 32.22351

str(template_WES_data)
'data.frame':   5200 obs. of  6 variables:
     $ date       : IDate, format: "2020-03-07" "2020-03-07" ...
$ location_id: int  1 1 1 1 1 1 1 1 1 1 ...
$ lat        : num  23.8 23.8 23.8 23.8 23.8 23.8 23.8 23.8 23.8 23.8 ...
$ lon        : num  90.4 90.4 90.4 90.4 90.4 ...
$ target_name: chr  "target_0" "target_0" "target_0" "target_0" ...
$ ct_value   : num  NA NA NA 29.9 31.6 ...
More detailed descriptions of each variable in the
template_WES_data object are shown in the table below:
| Variable | Class | Description |
|---|---|---|
| date | Date, IDate | The date the environmental sample was collected. Format is YYY-MM-DD. |
| location_id | Integer, Character | A unique identifier for each sampling location. |
| lat | Numeric | The lattitude of the sampling location in Decimal Degrees (DD) |
| lon | Numeric | The longitude of the sampling location in Decimal Degrees (DD) |
| target_name | Character | The unique name of each gene target in qPCR assays |
| ct_value | Numeric | The Cycle Threshold (Ct) value returned by qPCR assays |
And a the plot below shows the temporal distribution of the simulated
data in the template_WES_data object:
ggplot(template_WES_data, aes(x=sample_date, y=ct_value, color=target_name)) +
     geom_point(alpha=0.5) +
     facet_grid(rows=vars(location_id), cols=vars(target_name)) +
     scale_x_date(date_breaks = "3 month", date_labels = "%b %Y") +
     theme_bw() +
     theme(legend.position = 'none') +
     labs(x = element_blank(),
          y = "Ct value",
          title = "Template of simulated environmental sampling data")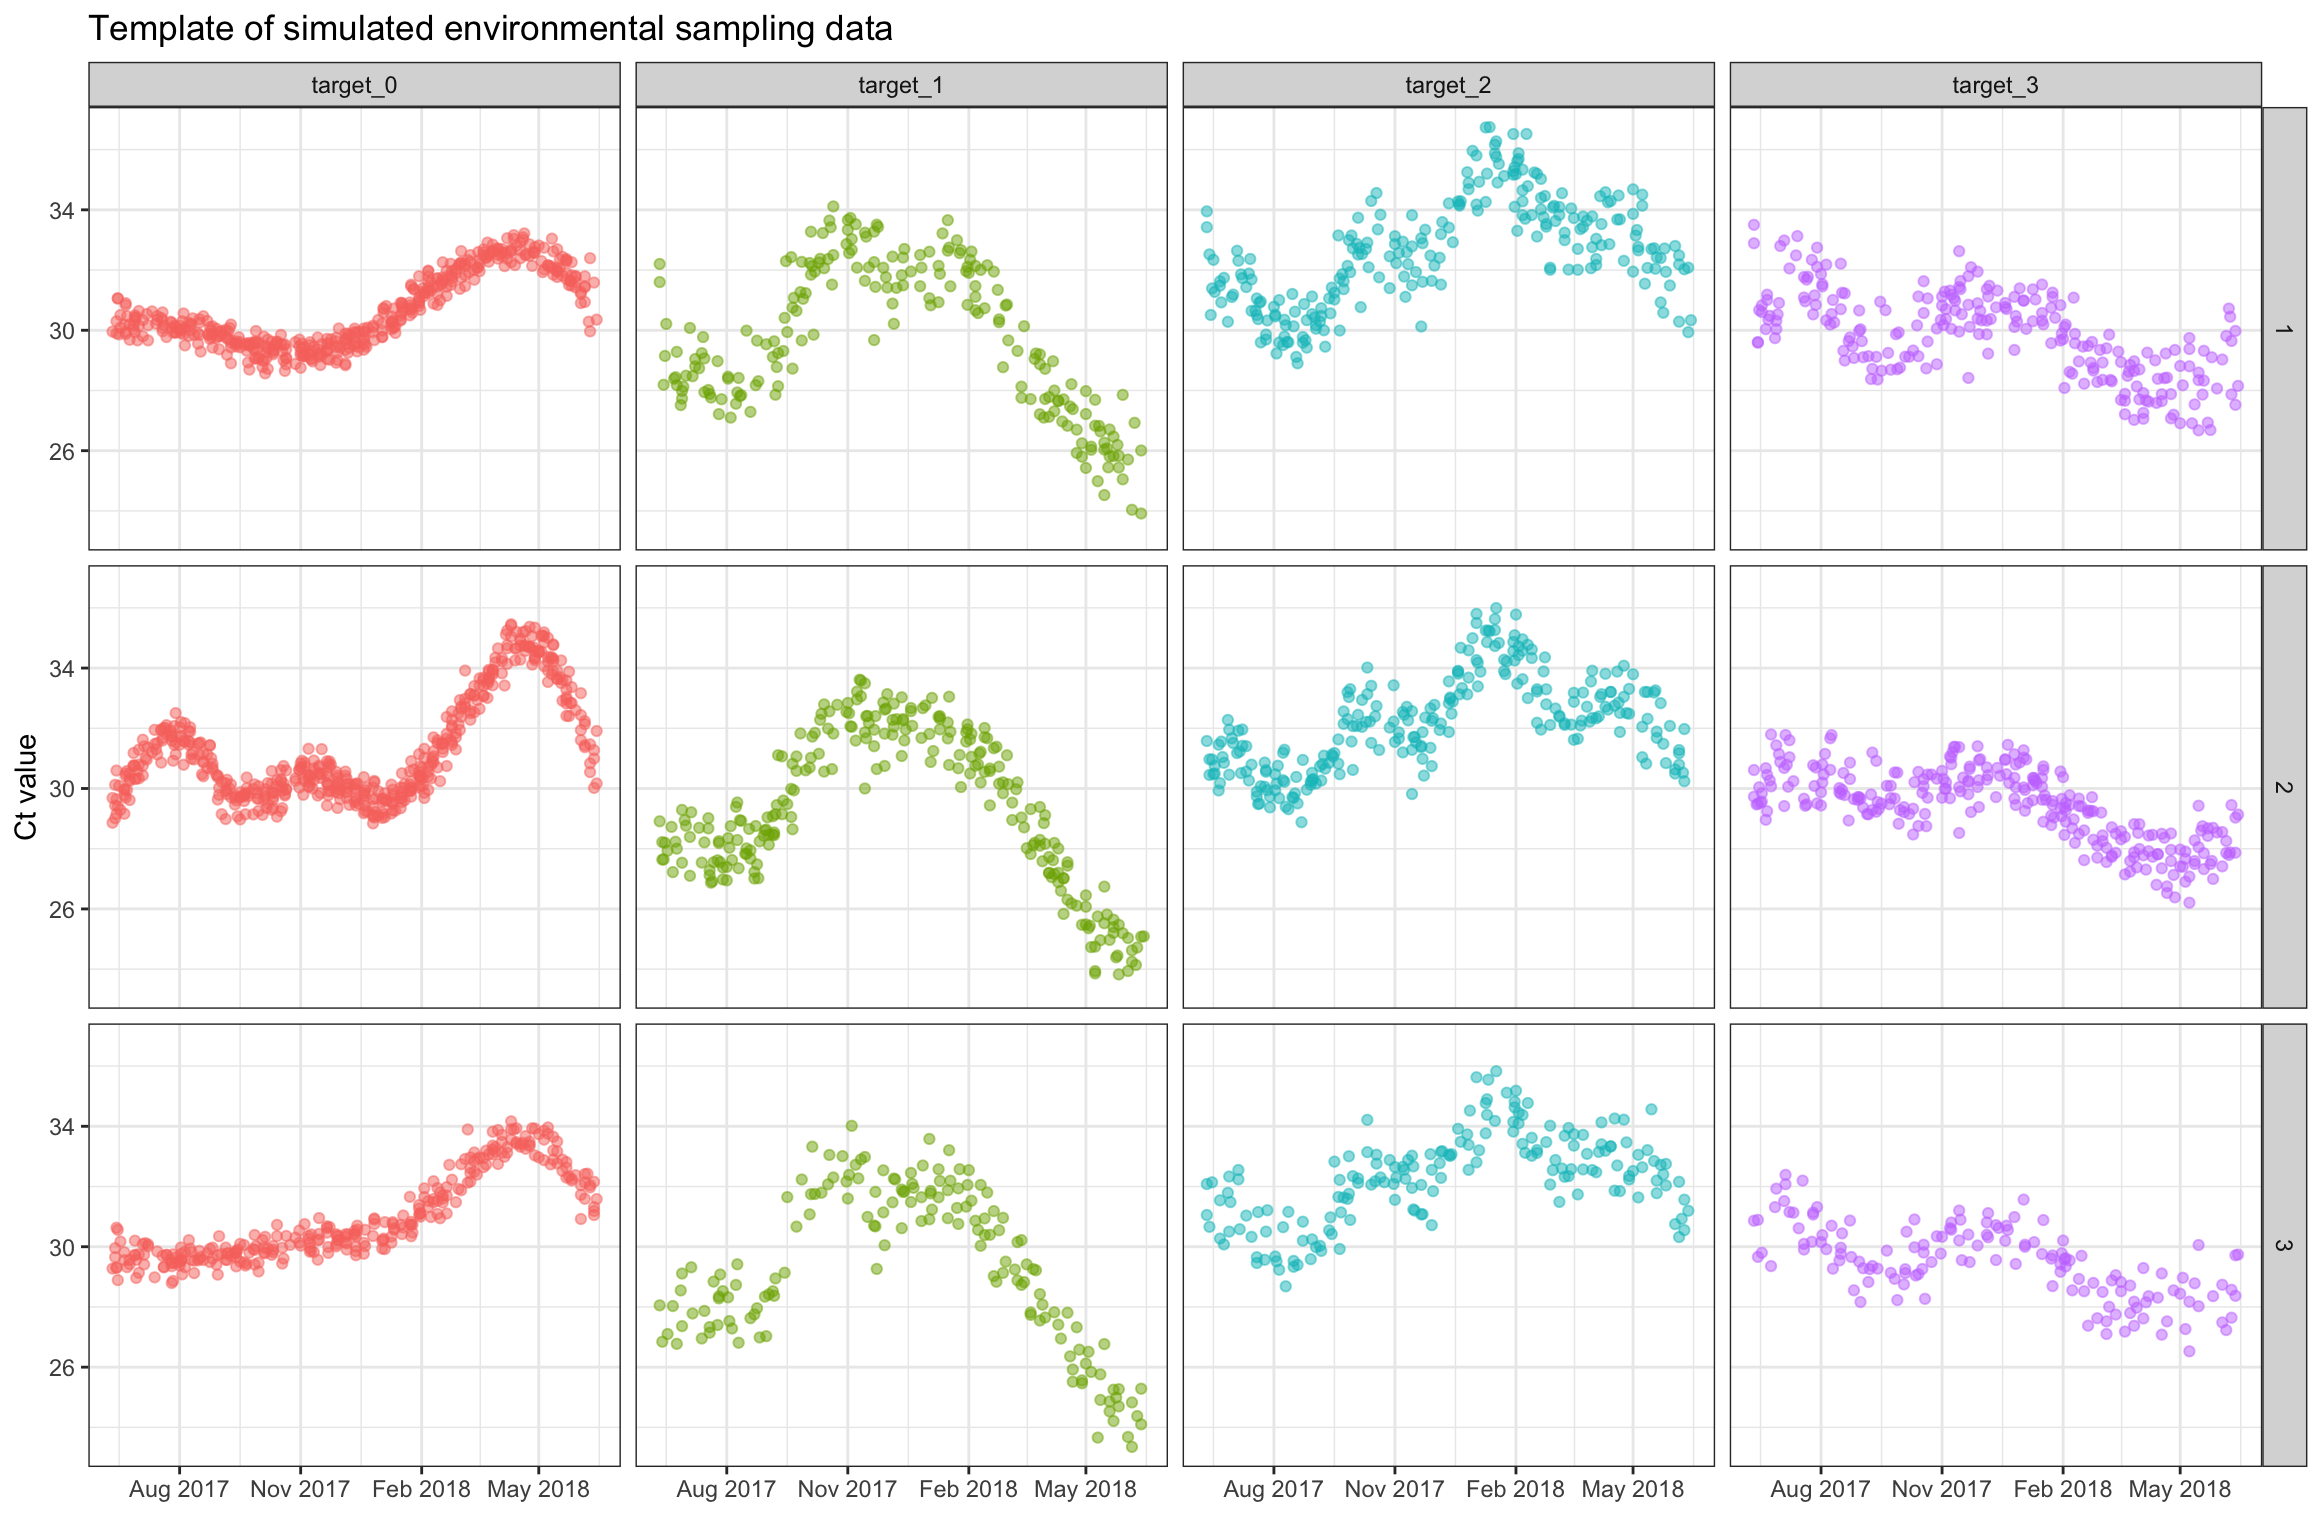
Template standard curve data
Standard curve data provide the results from standardized qPCR assays
which relate Ct values to the number of gene copies for a particular
target. With these data, the calc_n_copies() function will
infer the number of gene copies for each of the observed Ct values in a
data set formatted according to the template_WES_data
object. To view the template standard curve data, see the code
below:
library(WES)
head(template_WES_standard_curve)
  target_name n_copies ct_value
1    target_1    1e+01 31.29322
2    target_1    1e+02 27.73392
3    target_1    1e+03 23.48097
4    target_1    1e+04 18.91412
5    target_1    1e+05 16.68971
6    target_2    1e+01 32.34237

str(template_WES_standard_curve)
'data.frame':   15 obs. of  3 variables:
 $ target_name: chr  "target_1" "target_1" "target_1" "target_1" ...
 $ n_copies   : num  1e+01 1e+02 1e+03 1e+04 1e+05 1e+01 1e+02 1e+03 1e+04 1e+05 ...
 $ ct_value   : num  31.3 27.7 23.5 18.9 16.7 ...
More detailed descriptions of each variable in the
template_WES_standard_curve object are shown in the table
below:
| Variable | Class | Description |
|---|---|---|
| target_name | Character | The unique name of each gene target in qPCR assays |
| n_copies | Numeric | The known number of gene copies for the observation in the standardized qPCR assay |
| ct_value | Numeric | The Cycle Threshold (Ct) value returned by qPCR assays |
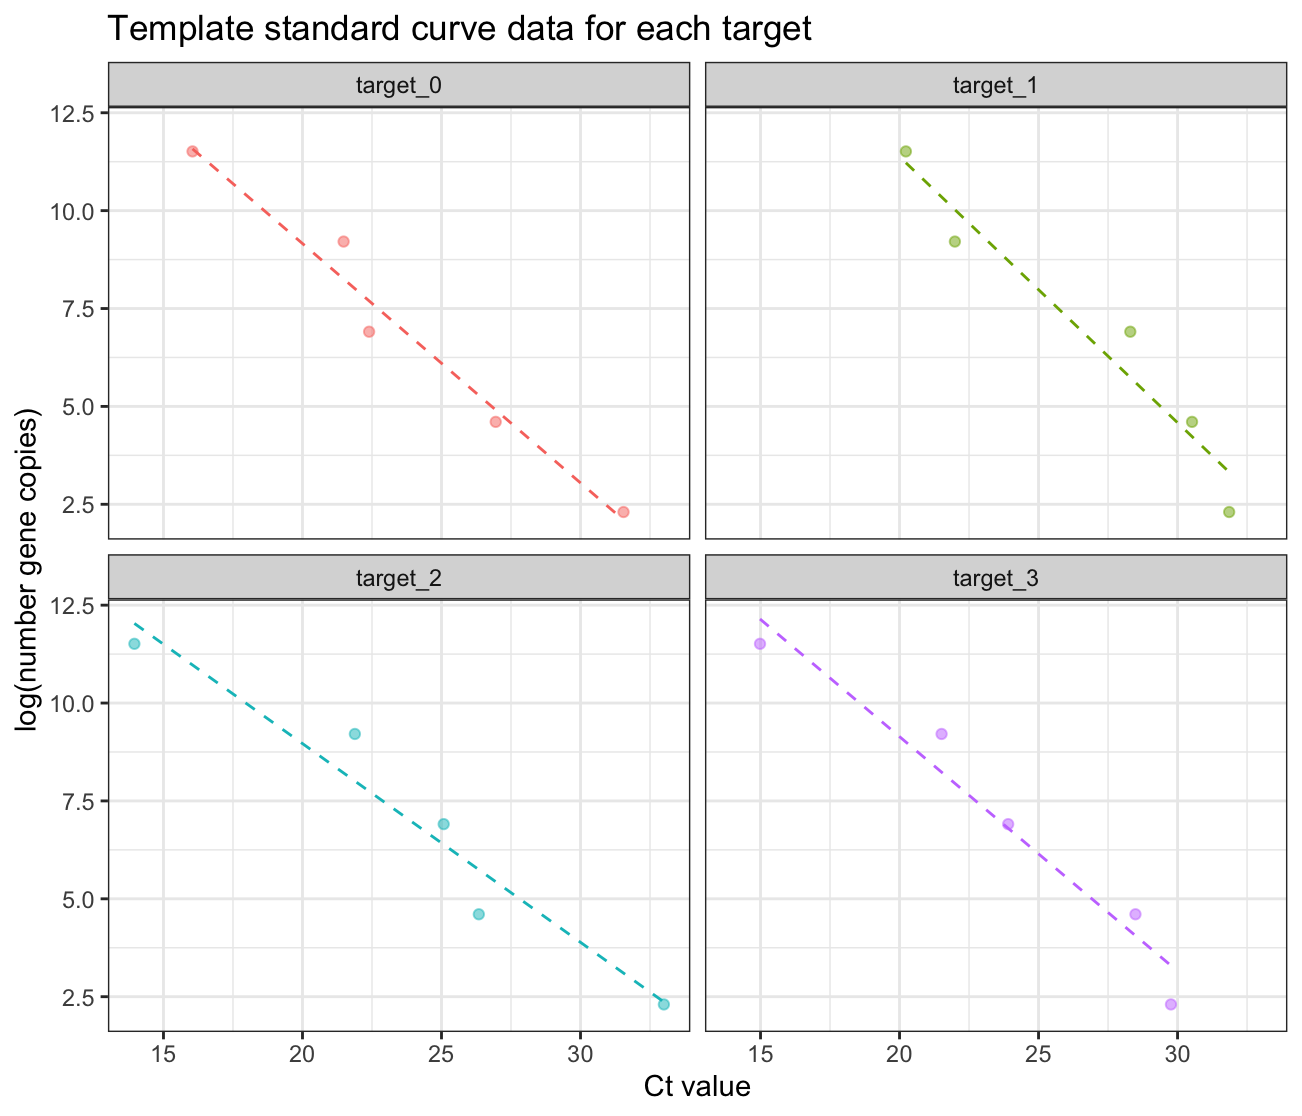
And the plot below shows the simulated standard curve data in the
template_WES_standard_curve object:
ggplot(template_WES_standard_curve, aes(x=ct_value, y=log(n_copies), color=target_name)) +
     geom_point(alpha=0.5) +
     geom_smooth(method = "lm", se = FALSE, size = 0.5, linetype=2) +
     facet_wrap(vars(target_name)) +
     theme_bw() +
     theme(legend.position = 'none') +
     labs(x = "Ct value",
          y = "log(number gene copies)",
          title = "Template standard curve data for each target")